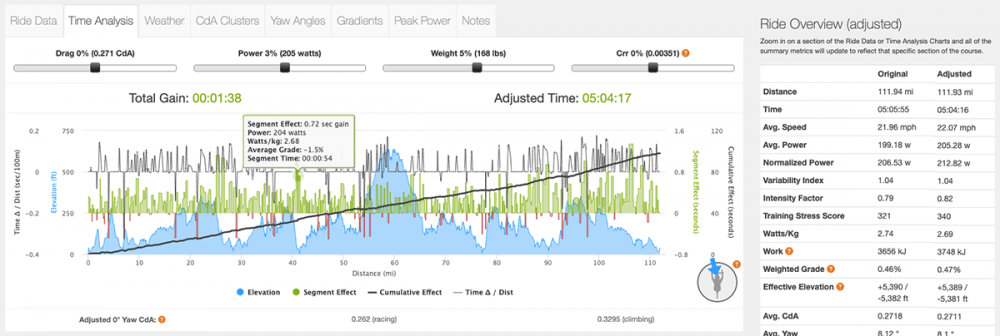
What is the Time Analysis chart and what does it tell me?
The Time Analysis chart is a unique tool for athletes and coaches to analyze the impact of power, drag, weight, and rolling resistance on race day performance. With the integration of this technology into the Analytics feature, users can now review past rides and determine how these variables would have affected their results.
Please keep in mind that this analysis has some differences from the Race Plan version. In Analytics, the app may exclude segments of the race where the athlete was experiencing significant acceleration or deceleration or when there are potential data anomalies in elevation or weather data. For example, in steep descents, changing the variables would not have altered the time as the athlete was likely breaking.

