What is the Peak Power chart?
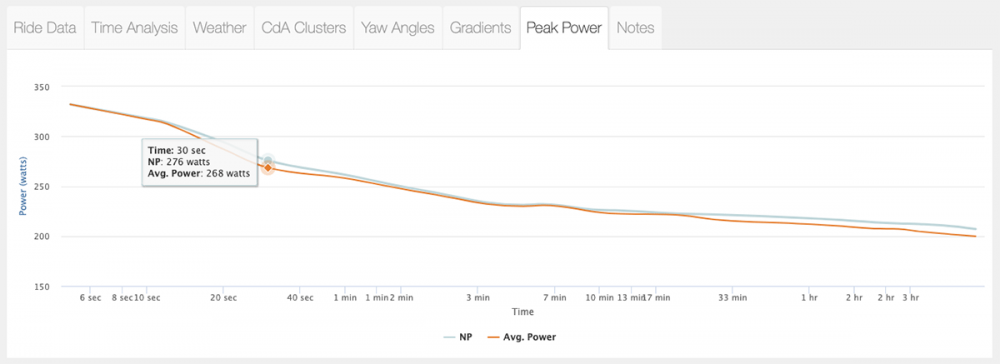
The Peak Power Chart shows the mean max average power values compared to the equivalent mean max normalized power values across different times for the race file. When compared to an athletes previously recorded peak power or power duration curve this data can be used to help set power limitations as well as minimum VI values in the advanced settings section or to find areas where an athlete may need work to achieve an optimal pacing strategy for a future race. This becomes especially powerful for lower powered athletes or in hilly terrain where athletes will struggle to maintain lower VI values.