What is the Gradients chart?
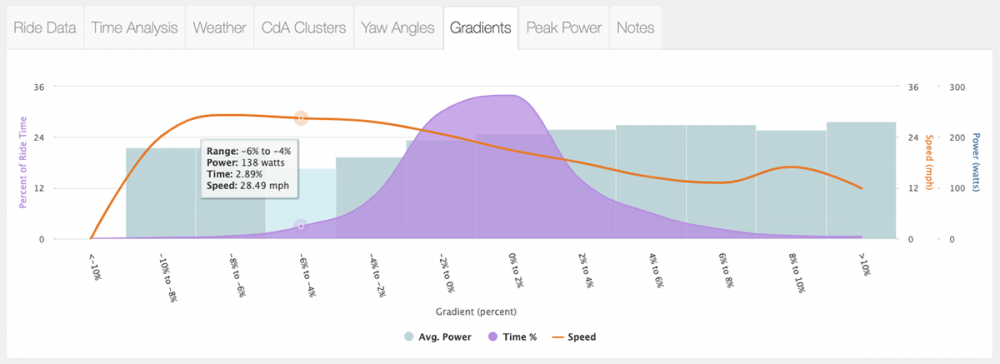
This chart shows the percentage of race time you spent in each road gradient range as well as the athlete's average speed and power for that range. This gradient data can help show areas of strength and weaknesses specific to the athletes descending skill and climbing power limitations, which you can use when setting max descent speeds or power limits within the race plan advanced settings options.