What is the CdA Clusters chart?
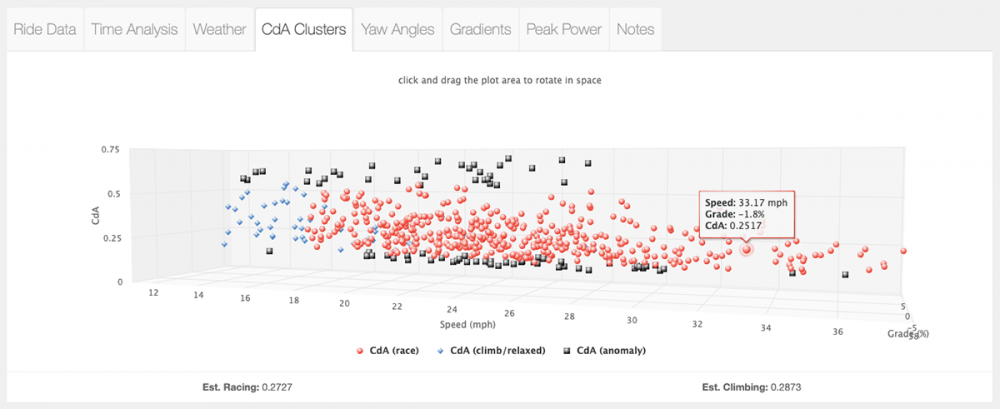
Once the algorithm calculates aerodynamic drag across the course we attempt to cluster this data into buckets representing Race, Climbing/Relaxed and Anomalies positions. These are used to derive the optional updates for your bike settings in BBS. The CdA Clusters chart displays these groupings in an interactive 3-D chart by CdA, Speed and Gradient. The chart can be rotated allowing you to gain insight into speeds and gradients where an athlete tends to change positions.