What is the Weather chart?
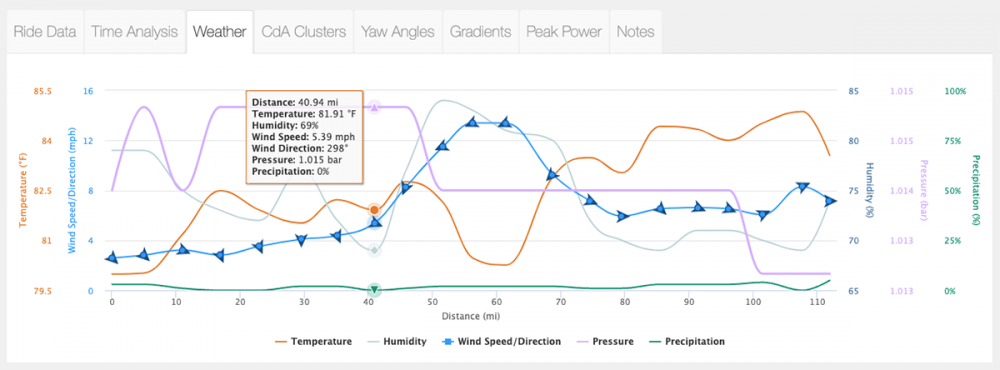
The Weather chart shows a forecasted or historical weather map for the course based on both location and time. The chart shows historical weather data from points along the course corresponding to the time that the athlete crossed into those zones. This data is pulled in from the closest weather station to the zone that the athlete was in at that time.
Temperature
Temperature is shown in either degrees Celsius or Fahrenheit depending on your unit settings.
Humidity
Relative humidity is the ratio of the current absolute humidity to the highest possible absolute humidity (which depends on the current air temperature). A reading of 100 percent relative humidity means that the air is totally saturated with water vapor.
Wind Speed & Direction
Wind speed is shown in either miles per hour or kilometers per hour depending on your unit settings. The wind direction is shown in degrees and represents the direction that the wind is coming from, with true north at 0° and progressing clockwise. The graphic arrows point in the direction that the wind is going and are positioned relative to the course map, with north being at the top of the map.
Pressure
Barometric pressure (also known as atmospheric pressure) is the force exerted by the atmosphere at a given point. It is known as the "weight of the air". Measurement of barometric pressure is in bars, with normal pressure at sea level being 1.013 bars.
Precipitation
Precipitation is shown as a percent chance that rain (0.01 inch or more) will fall somewhere within the forecasted area.