How do I see metrics for specific sections of the Ride Data?
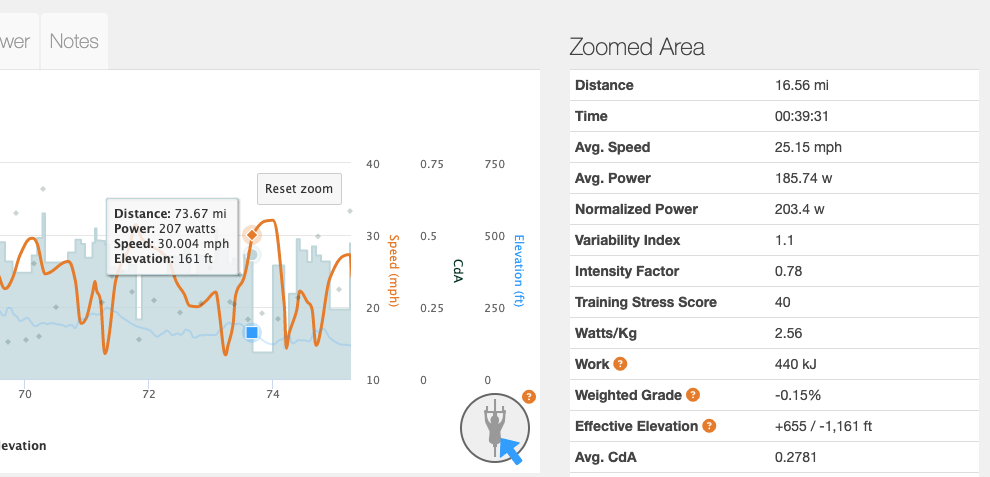
When you zoom in on a section of the Ride Data chart all of the summary metrics will update to reflect that specific section of the course. This allows athletes and coaches to do a deeper analysis of the race on areas such as major climbs, windy sections and/or out and back sections. To zoom simply click and drag across the Ride Data chart. When you reset zoom, change chart type or switch tabs the Race Overview data will revert back to the total overview. You will notice that the power data is processed in a segmented style. This has been done to support BBS analysis and future functionality.