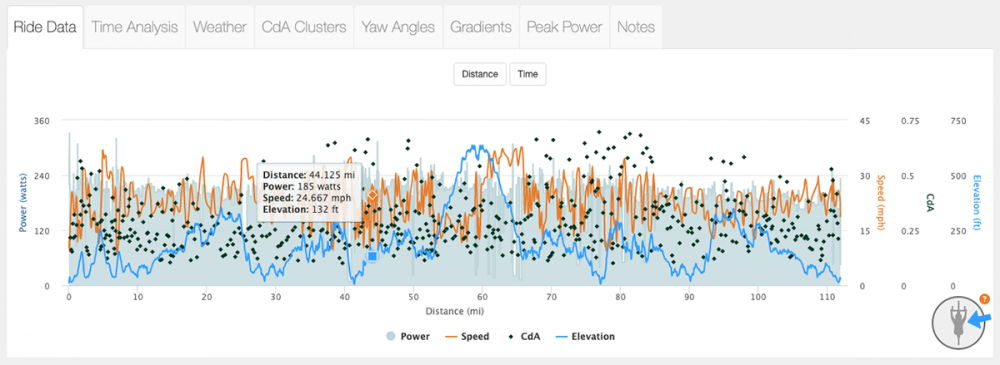
What is the Ride Data chart?
This chart plots out the general ride data from your uploaded file along with calculated CdA points through out the course. As you hover over the chart you will see the marker on the map move to the section of the course that corresponds to that data as well as an indicator of the wind relative to the rider for that location on the course. Click and drag across the Ride Data chart to zoom in on a section and all of the summary metrics will update to reflect that specific section of the course. To remove a data set simply click that data's label shown under the graph.