How do you tell the difference between good and bad data input?
The Estimated CdA is very dependent on good data. There are a lot of areas where data can get corrupted from uncalibrated (or in some cases left only) power meters, bad barometric or GPS elevation data, poor location data, and/or inaccurate weather information. We do our best to help alleviate this behind the scenes, but with all of the variables bad data is bound to sneak through sometime. Ideally with the perfect setup and known conditions the CdA data will appear as a straight line across, but these conditions rarely if ever actually exist outside the trainer or velodrome. Conveniently we use some techniques in our algorithm to minimize the impacts from real world data flukes as much as possible.
It is often fairly obvious to determine whether the input data is good visually from the resulting CdA data. A couple of examples are shown below and more information can be found in our case study here (link to case study).
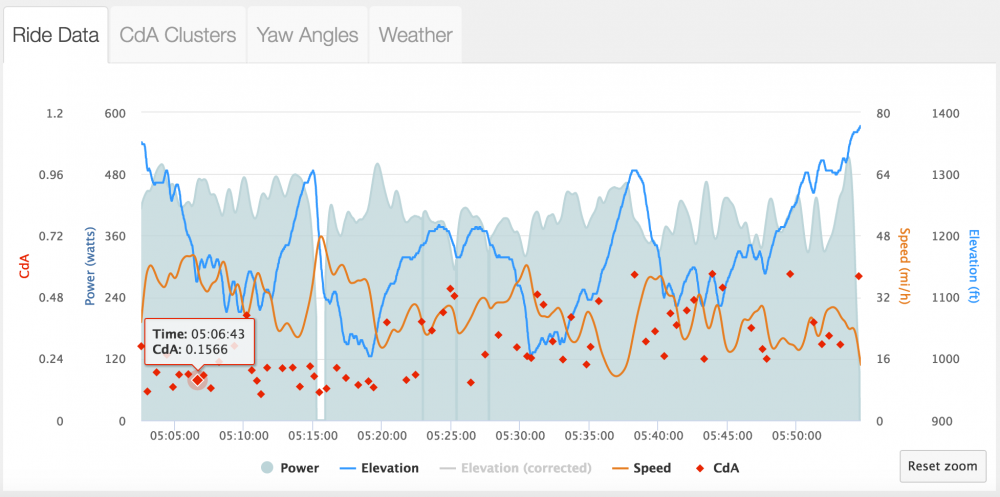
On a hilly course in sections where an athlete would normally stay in an aero position if the CdA numbers are much higher for the slightly uphill sections compared to the slightly downhill sections it is an indication that the weight in the algorithm may be too low compared to actual. Below is a case where there is a disparity on the same sections of uphill to downhill. Because the athlete is above 20 MPH for both of these they should be staying as aerodynamic as possible.
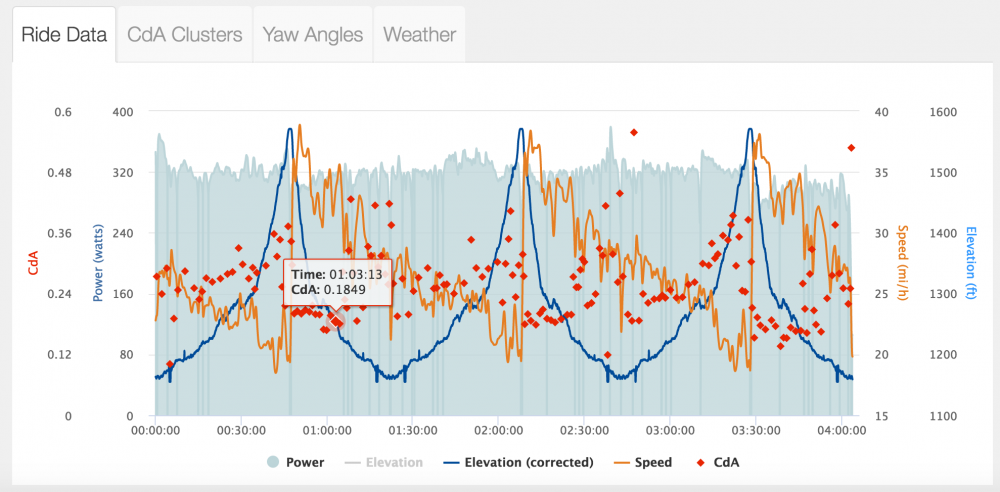
This is an example of an out and back where historical wind data was off by 180 degrees so what looked to the analysis like a head wind out and tail wind back was actually a strong tailwind out and head wind back. Thus the calculated CdA numbers on the way out where too low whereas the numbers on the way back were too high.