What is the "Yaw Angle Distribution" chart and what does it tell me?
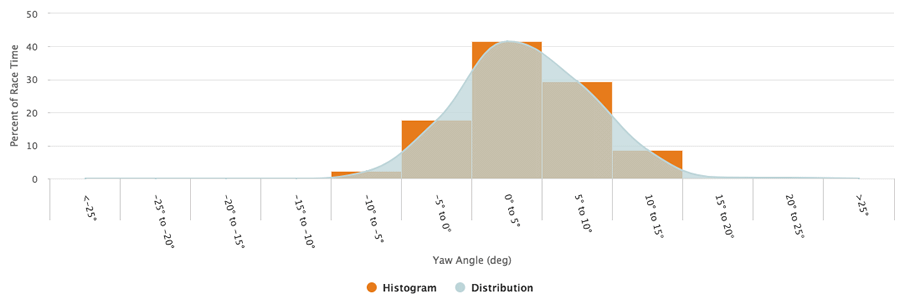
This chart shows you the percentage of race time you will spend in each yaw angle range based on your goal targets and weather data inputs. The yaw angle data can be used to help with race day equipment selection or can be used to support purchasing decisions. Many bikes and wheels are now designed to be faster at certain yaw angles so knowing the yaw angles you tend to experience most often in your races can help guide your major purchase decisions. To remove a data set on the chart simply click that data's label shown under the graph.
Larger yaw angles indicate crosswinds while smaller angles will be more direct head or tail winds. The general rule of thumb is to go as deep as you can from 0-12.5 degrees yaw. Above 12.5 degrees it is very athlete dependent based on the athletes ability to stay steady and in position in the crosswinds. On courses with more hills this changes a bit based on weight and speed.