What is the "Time Analysis" tool and how do I use it?
The Time Analysis tool allows you to view the estimated time difference for changes in Power, Weight and/or Drag for the race at both the individual segment level as well as the total cumulative time difference. Here are just a few things you could do with the Time Analysis feature.
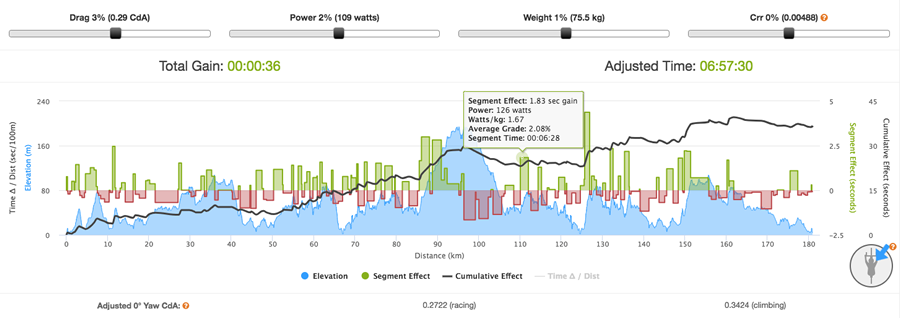
When you zoom in on a section of the Time Analysis Tool Chart all of the summary metrics will update to reflect that specific section of the course. You may also adjust the Power, Weight and Drag sliders to see the effect on your zoomed area. This allows athletes and coaches to do a deeper analysis of the race plan on areas such as major climbs, windy sections and/or out and back sections. To zoom simply click and drag across the Time Analysis Tool Chart. When you reset zoom or switch tabs the Race Summary data will revert back to the total overview.
- Discover time savings and losses from varying power, weight, and/or drag
- Find which variable gives the biggest % change for a course
- Set time range goals for a race based on various power ranges
- Determine time difference for current fitness level vs. planned race day fitness
- Compare old race results with that of new power, weight and/or drag numbers
- Analyze where on the course it makes most sense to stay as aero as possible or relax
- Help refine drag inputs into the model based on known power, weight and time
- Select a specific course based on anticipated fitness levels and training goals
- Set specific training goals tailored to an A race course and typical conditions