
What is the Zones or "Time in Zones" chart and what does it tell me?
The "Time in Zones" chart provides a visual representation of the cumulative time spent in each training or racing zone during your race. This chart helps you understand the distribution of effort across different intensity levels, which can guide your future training focus and ensure you adequately prepared for the demands of your race.
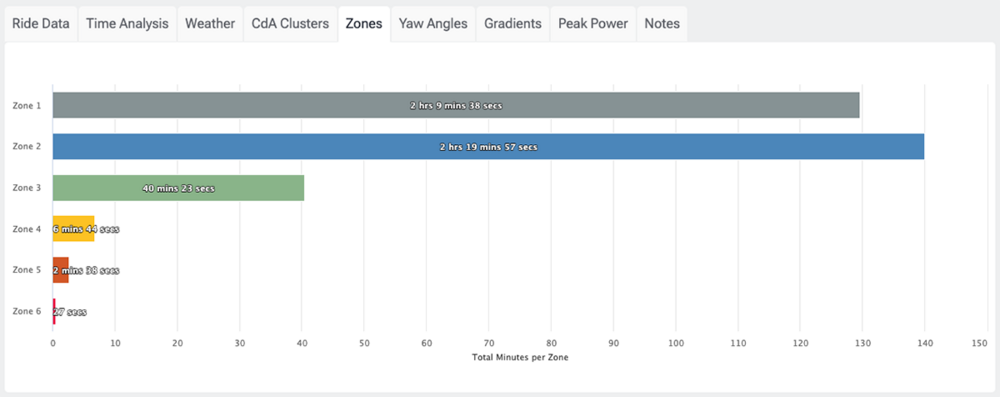
Zone 1
Recovery (< 60%)
Very easy. Promotes blood flow, aids recovery, warm-up/cool-down.Zone 2
Endurance (61 - 75%)
Easy-steady. Builds aerobic base and fat oxidation; conversational pace.Zone 3
Tempo (76 - 90%)
Steady-hard. Muscular endurance; sustainable 1–3 hours.Zone 4
Threshold (91 - 105%)
Hard but controlled. Raises lactate threshold; 8–30 min intervals.Zone 5
VO2 Max (106 - 120%)
Very hard. Improves max aerobic power; 2–6 min repeats.Zone 6
Anaerobic (> 121%)
Maximal efforts. Sprints/short bursts; 10 sec to ~2 min.