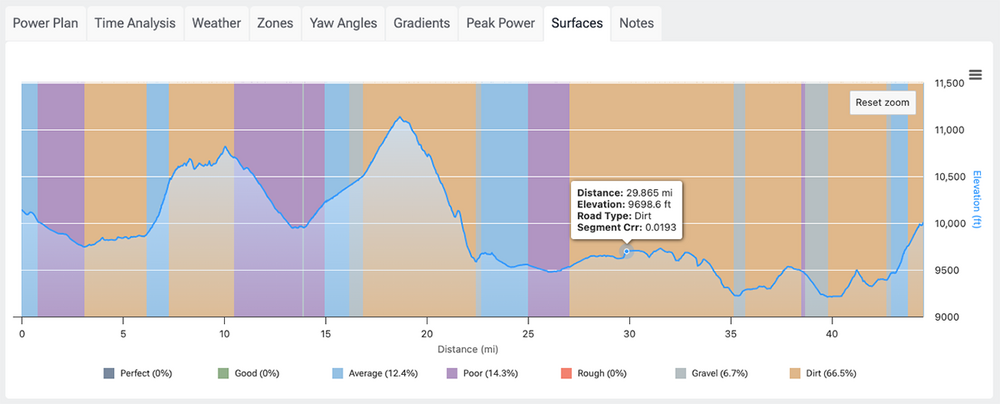
What is the Surfaces chart and what does it tell me?
The Surfaces Chart shows the road and off-road conditions along the race course, with each section color-coded by surface type. As you scroll across the chart, you can see the corresponding coefficient of rolling resistance (Crr) for each segment and where transitions occur between pavement, gravel, or dirt. Additionally, you can click and drag across the chart to zoom into specific sections of the course, and the map will zoom and highlight that selected area.